Graphing exponential Growth functions:
Essentially, an exponential growth function is a function in the form of y=ab^x, where the value of a is not zero and the value of b is a positive number that is not 1.
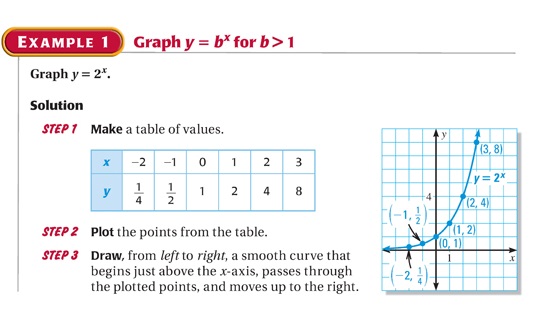
Graphing an exponential growth function is almost exactly like graphing any other function, you make a table that gives you the x and y values of the function, and plot those points on the graph, as shown below.
Graphing an exponential growth function is almost exactly like graphing any other function, you make a table that gives you the x and y values of the function, and plot those points on the graph, as shown below.
It is also worth noting that the variable b can also be referred to as the growth factor, in case that term pops up somewhere.
