Graphing and solving quadratic inequalities:
A quadratic inequality with two variables can be modeled in one of four ways:

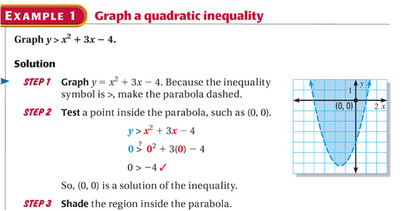
When graphing a quadratic inequality it is important to first graph the function of y= ax^2 + bx + c, using dotted lines when > or < is used, and using a solid line when ≥ or ≤ is used. Then test point (x,y) inside the parabola to determine which side of the parabola the solutions lies; shading either the inside or outside of the parabola respectively.